
Park Forest, IL-(ENEWSPF)- This work has been at times exhausting, but our survey of 30 South Suburban towns and how they have been impacted by COVID-19 continues to be exhaustive and comprehensive. The numbers of those testing positive for this virus continue to rise. Figures are unchanged from Ludeman Center since May 7, but Park Forest has tapped on the 400-level ceiling and will likely crack through Sunday or Monday. Chicago Heights added over 30 new cases of the virus according to the IDPH.
We are not out of the woods yet. Don’t know if there is such a thing as “out of the woods” with this virus. There is just going on.
Cicero still has the largest number of SARS-CoV-2 (COVID-19) cases in all of suburban Cook County, adding an astonishing 145 newly confirmed cases since we surveyed two days ago. The town of almost 34,000 people has 1,625 and a rate of 1,937.08 per 100,000, surpassing Park Forest’s rate which now sits at 1,838.62.
The Village of Park Forest has 394 total confirmed cases with 196 of those located at Ludeman Center as of May 7, 2020, the last time Parents & Friends of the Ludeman Center updated stats on their website. However, on that date, Ludeman Center only had 2 pending results, so the increase of cases in Park Forest is likely outside Ludeman Center.
South Chicago Heights now has the third-highest rate per 100,000 with only 62 cases but a rate of 1497.95.
eNews Park Forest continues to track the number of cases and the rate per 100,000* cases for 30 municipalities in the South Suburbs.
The Will County Health Department reports 32 cases of COVID-19 in the Will County section of Park Forest as of May 9, 2020. That’s one more since we reported two days ago.
As of this writing, Chicago Heights now has 352 confirmed cases and a rate of 1162.64 per 100k. Steger has 56 cases, Flossmoor 62, Richton Park 157, Olympia Fields 46, Sauk Village 82, Glenwood 94, Tinley Park 204, and South Chicago Heights has 62.
Harvey has 272 cases, Country Club Hills has 239 cases, Orland Park 276, Lynwood 96, Lansing 240, Homewood 205, South Holland 276, Calumet City 379, Markham 156, and Crete 104. Ford Heights now has 22 cases.
Read: Kopy’s Kolumn: Welcome to the Pandemic World Order
Currently, IDPH is reporting a total of 76,085 cases, including 3,349 deaths, in 98 counties in Illinois. The age of cases ranges from younger than one to older than 100 years. Within the past 24 hours, laboratories have processed 16,617 specimens for a total of 416,331.
As of May 9, 2020, there are a total of 19,809 confirmed cases of COVID-19 in suburban Cook County and 809 deaths; 138 cases are in congregate settings, such as long term care facilities or nursing homes, are reporting one or more confirmed cases. The data from Cook County includes all cases under the jurisdiction of the Cook County Department of Public Health (excludes Chicago, Evanston, Oak Park, Skokie, and Stickney Township). All numbers are provisional and subject to change.
The Cook County Medical Examiner reports 2,364 total COVID-19 related deaths since March 16, 2020, as of May 9, 2020.
As of this writing, Will County now reports 3,655 confirmed cases and 202 deaths.
Deceased from COVID-19
One more person from the Cook County portion of Park Forest died of COVID-19 since we last tallied comprehensively on May 7. The Village has now lost 11 residents to the disease. The number of deceased from Chicago Heights remains at 18 since we tallied May 7. Cicero lost 32, Richton Park 8, Matteson 17 (two more since May 7 numbers), and Country Club Hills 19 (three more since May 7). The number of deaths in Steger (Cook County) is unchanged since April 28 at 3.
The City of Chicago has lost 1,353 people to COVID-19.
Ludeman Center Update
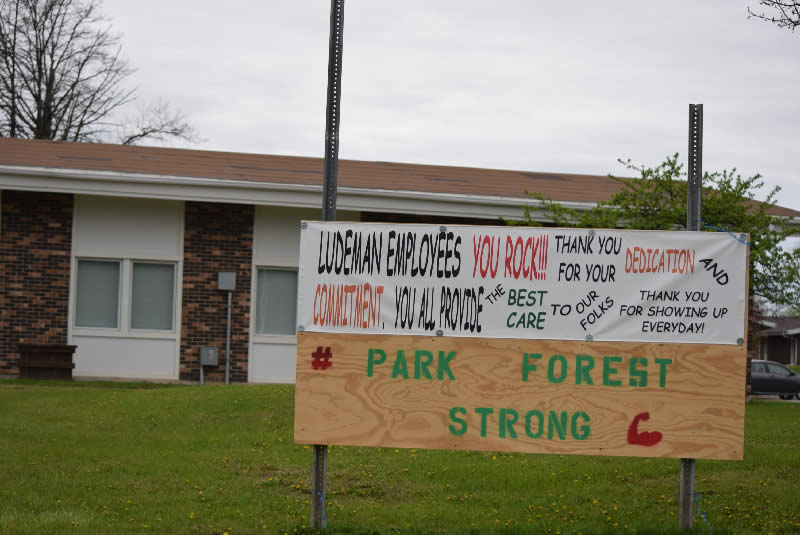
As already mentioned, Parents & Friends of the Ludeman Center last provided an update on May 7, 2020:
“Ludeman has tested all residents at the Ludeman Center for COVID-19. The testing is based on recommendations from the infectious disease physician who is consulting with the Divisions of Developmental Disabilities and Mental Health. This will enable Ludeman to continue the best possible precautionary, clinical and medical programming and supports for the people they serve. Ludeman will notify families of the testing process and results.
The group received the following information from the Ludeman Center for the May 7 COVID-19 testing results:
- Ludeman Residents: 196 tested positive. 146 tested negative. 2 pending results.
- Ludeman Staff: 70 tested positive.
- 35 of 38 occupied Ludeman Homes have individuals that have been tested for COVID-19.
Wellness checks are being conducted on staff members before reporting to their respective assignments, the group says.
Ludeman Center is in great need of the following supplies, the group notes:
- Disposable Stethoscopes
- Disposable Surgical Gowns
- Surgical KN95 Masks
- Oral or Temporal Thermometers
- Wall Mounted Hand Sanitizers – Holder and Sanitizer Supply
- Sanitizer Wipes, Disinfectant Spray
“If you are able to fulfill any of the above supplies to Ludeman, e-mail us at [email protected] and we will be happy to pick up or give you instructions to ship your donation,” Parents & Friends of the Ludeman Center says.
Current COVID-19 Cases for 30 South Suburban Towns
| Municipality | COVID-19 Cases | Most Recent Population Figures | Rate per 100,000 Population* |
| Calumet City | 379 | 37042 | 1023.16 |
| Chicago Heights | 352 | 30276 | 1162.64 |
| Cicero | 1625 | 83889 | 1937.08 |
| Country Club Hills | 239 | 16541 | 1444.89 |
| Crestwood | 71 | 10950 | 648.40 |
| Crete | 104 | 8117 | 1281.26 |
| Dolton | 245 | 23153 | 1058.18 |
| East Hazel Crest | 8 | 1543 | 518.47 |
| Flossmoor | 62 | 9464 | 655.11 |
| Ford Heights | 22 | 2763 | 796.24 |
| Frankfort | 102 | 19178 | 531.86 |
| Glenwood | 94 | 8969 | 1048.05 |
| Harvey | 272 | 25282 | 1075.86 |
| Hazel Crest | 163 | 14100 | 1156.03 |
| Homewood | 205 | 19323 | 1060.91 |
| Lansing | 240 | 28331 | 847.13 |
| Lynwood | 96 | 9007 | 1065.84 |
| Markham | 156 | 12508 | 1247.20 |
| Matteson | 267 | 19009 | 1404.60 |
| Oak Forest | 132 | 27962 | 472.07 |
| Olympia Fields | 46 | 4988 | 922.21 |
| Orland Park | 276 | 56582 | 487.79 |
| Park Forest | 394 | 21429 | 1838.63 |
| Richton Park | 157 | 13646 | 1150.52 |
| Sauk Village | 82 | 10506 | 780.51 |
| South Chicago Heights | 62 | 4139 | 1497.95 |
| South Holland | 276 | 22030 | 1252.84 |
| Steger | 56 | 9331 | 600.15 |
| Tinley Park | 204 | 49235 | 414.34 |
| University Park | 77 | 6958 | 1106.64 |
| Combined | 6464 | 606251 | 1066.23 |
*Numbers per 100,000 based on most recent population from US Census.gov or derived via formulat using rate per 100,000 population and COVID-19 cases as reported by Cook County. |
|||
The following chart will auto-update as we update our Google spreadsheet:
This chart might not appear on all mobile devices. It does not appear, for example, in the browser built into the Apple Facebook app.
Projections
The Institute for Health Metrics and Evaluation (IHME) says the number of COVID-19 cases peaked in Illinois on April 17, but testing continues. Hence, the number of cases in the South Suburbs continues to rise. The IHME also says the peak death rate from the worst pandemic in anyone’s memory has also passed in Illinois.
IHME projections assume strict social distancing continues until infections are minimized and containment implemented.
Mask Requirement in Illinois Now in Effect
Gov. J.B. Pritzker’s stay-at-home order will continue in Illinois through the month of May. Additionally, he is requiring a “face-covering or mask” for all over the age of two under certain circumstances.
The Governor said:
Starting on May 1, any individual over the age of two and able to medically tolerate a face-covering or mask will be required to wear one when in a public place where they can’t maintain a six-foot social distance. Face coverings work and we need all Illinoisans to do their part here.
For our essential businesses, including manufacturers, we are issuing new requirements on social distancing and new caps on occupancy.
Again all of these things won’t take effect until May 1 – a week from tomorrow. And they are only minor modifications – what we can do safely – while keeping our stay at home restrictions in place as we manage through to the next phase.
This order was further modified to allow religious gatherings of up to 10 people.
Overall for the State of Illinois
The Illinois Department of Public Health (IDPH) on May 9 announced 2,325 new cases of coronavirus disease (COVID-19) in Illinois, including 111 additional deaths.
- Clinton County: 1 male 80s, 1 female 90s
- Cook County: 1 male 20s, 4 females 50s, 7 males 50s, 4 females 60s, 9 males 60s,
7 females 70s, 13 males 70s, 1 unknown 70s, 8 females 80s, 7 males 80s, 4 females 90s, 1 male 90s, 1 unknown 90s, 2 females 100s - DeKalb: 1 male 60s
- DuPage: 1 female 60s, 2 females 70s, 1 male 70s, 1 male 80s, 7 females 90s, 1 male 90s
- Iroquois: 1 female 90s
- Kane: 1 female 70s, 2 females 80s, 1 male 80s
- Kendall: 1 male 50s, 1 female 90s
- Lake: 1 female 70s, 2 males 90s
- LaSalle: 1 female 60s, 1 male 80s
- Madison: 1 female 80s
- McHenry: 1 male 70s, 1 female 80s, 2 males 80s
- Rock Island: 1 male 80s
- St. Clair: 1 male 40s, 1 female 80s, 1 male 90s
- Will: 1 female 60s, 1 male 70s
- Winnebago: 1 female 80s, 1 male 90s
- Out of State: 1 female 90s
Currently, IDPH is reporting a total of 76,085 cases, including 3,349 deaths, in 98 counties in Illinois. The age of cases ranges from younger than one to older than 100 years. Within the past 24 hours, laboratories have processed 16,617 specimens for a total of 416,331.
*All data are provisional and will change. In order to rapidly report COVID-19 information to the public, data are being reported in real-time. Information is constantly being entered into an electronic system and the number of cases and deaths can change as additional information is gathered. Information for deaths previously reported have changed, therefore, today’s numbers have been adjusted. For health questions about COVID-19, call the hotline at 1-800-889-3931 or email [email protected].
*Why Rate Per 100,000?
We found a clear explanation for viewing the rate of infections per 100,000 comes from Indiana University at Bloomington: “There may or may not be 100,000 residents in the county under review, but multiplying the result by 100,000 makes that rate comparable with counties with more than 100,000 or less than 100,000.”
“It is customary to use rates per 100,000 population for deaths and rates per 1,000 population for live births,” our source at Indiana University says.
So, none of the cities, towns, and villages we survey have 100,000 residents, but by using the rate per 100,000, we are able to compare apples to apples, so to speak, as if every town did have 100,000 residents.
eNews Park Forest will continue to track the effects the COVID-19 pandemic has on our region.


